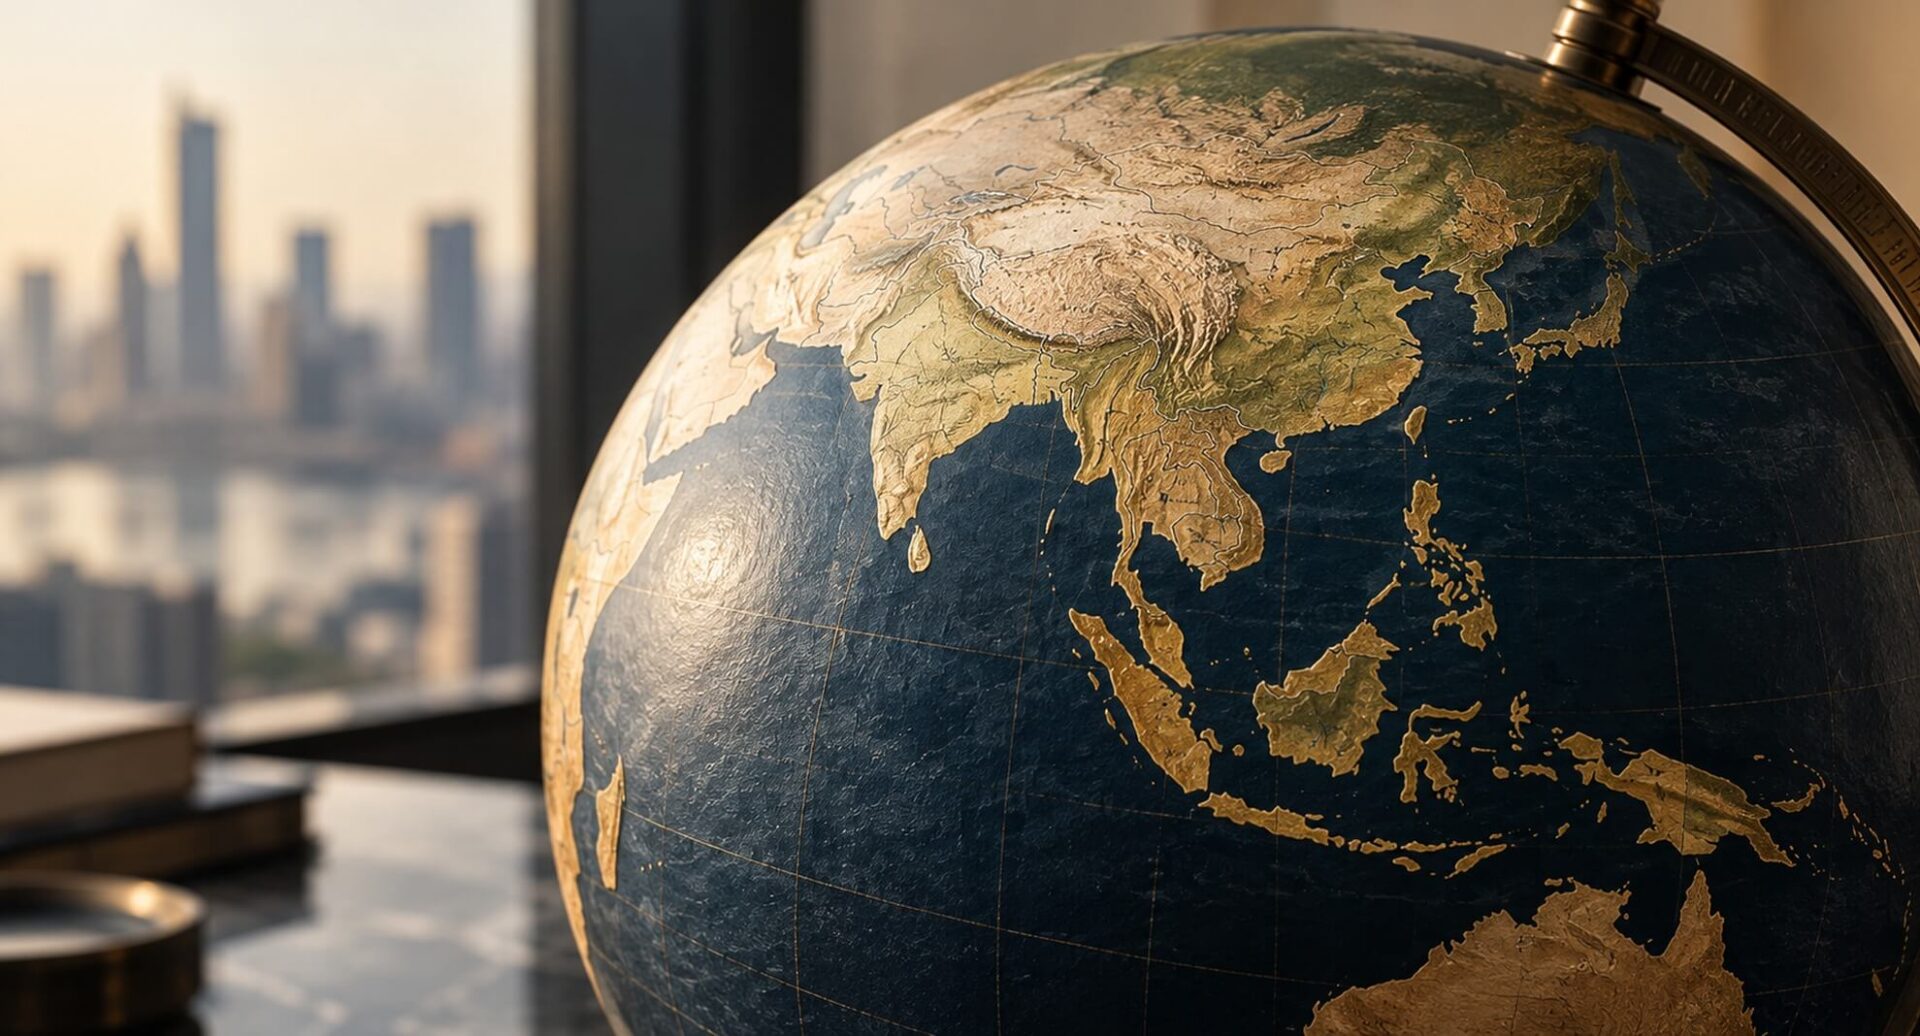
Following our earlier article featuring the viewpoints of leading investment attraction professionals, this time we take a closer look at six major rankings and datasets. Read together, they show that India and Southeast Asia attracted more capital in 2025, even as announced greenfield investment declined. Investment in supply chain-intensive manufacturing fell particularly sharply. The figures also raise questions about the strength of the China plus one story.
Foreign direct investment into Southeast Asia rose from US$222.3 billion to US$243.9 billion in 2025, making it the largest recipient subregion in developing Asia. Inflows to India grew 44% to US$39 billion. Good news for investment promotion agencies across the region.
But the same data tell a less positive story about new investment projects. Announced greenfield investment across ASEAN fell 10.1% to US$105.6 billion. Investment in global value chain-intensive manufacturing in Southeast Asia more than halved, from US$31 billion to US$14 billion. In India, the announced value of greenfield projects fell from US$111.14 billion in 2024 to US$74.12 billion in 2025.
These measures capture different things. Greenfield announcements record what companies say they plan to build. Headline FDI also includes acquisitions, reinvested earnings and money moved within companies. Southeast Asia therefore received more capital in 2025, but announced less investment in new productive capacity. We look at this gap and what it means for how places present themselves to investors.
Six rankings, six different questions
When a ranking says a market is attractive, it rarely tells us for whom, or for what kind of investment. A manufacturer looks first at land, logistics, labour and energy. A technology company is more interested in talent, universities and venture capital. A regional headquarters looks at connectivity and how easily people and money can move. That distinction matters when reading the six sources.
- Kearney FDI Confidence Index 2026. A survey of 507 senior executives at large companies, conducted in January 2026, on which markets they see as most attractive over the next three years. It records intentions, not money that has moved. Singapore rises to eighth, its best position since 2012. Thailand re-enters at 20th and Malaysia at 21st, its first appearance since 2014. India moves from 24th to 22nd.
- UNCTAD World Investment Report 2026. Tracks actual FDI flows worldwide, alongside separate data on greenfield announcements, acquisitions and project finance. These are different measures and should not be treated as interchangeable.
- ASEAN Investment Report 2025. Published by the ASEAN Secretariat with UNCTAD, it provides regional details for 2024. Manufacturing investment projects fell by almost half to US$58 billion, accounting for about half of the total value of announced greenfield investment. Electronics and electrical equipment alone attracted US$31 billion in announced greenfield investment.
- World Bank Business Ready (B-READY). Measures the conditions firms actually operate in. Singapore, Indonesia, Vietnam and the Philippines were covered in the 2024 edition, with Malaysia joining in 2025. India and Thailand are included in the planned expansion for the 2026 edition. The World Bank is still refining the methodology: comparisons between editions require care, although it describes the 2024 and 2025 methodologies as broadly comparable.
- WIPO Global Innovation Index 2026. Ranks 139 economies. Singapore is fifth. Malaysia is 34th, India 38th, Vietnam 43rd, Thailand 44th, the Philippines 52nd and Indonesia 55th. India and Vietnam have performed above the level expected for their economic development for 16 consecutive years.
- Savills Growth Hubs. A forecast of growth to 2035 across 245 cities. It is a growth model, not an investment ranking. It is also the only one of these six sources specifically focused on forecasting city-level growth.
Where the rankings disagree
Kearney’s main index and its Emerging Markets Index tell different stories about India. India rises on the main index but falls from fifth to eighth among emerging markets. This is largely because other markets moved up. Thailand climbed from tenth to sixth and Malaysia from eleventh to seventh, while Mexico moved from sixth to fifth.
The details of the survey are more useful than the ranking itself (and that is almost always the case across the rankings we regularly monitor and report on). Asked what makes each market attractive, 40% of respondents named the talent of India’s labour pool, the highest score for any single factor in the index. For Thailand and Malaysia, the most common answer was ease of doing business, at 31% each. Neighbouring markets are clearly being chosen for different reasons.
Malaysia is the most contradictory case. Its inflows rose 50.8%, the strongest increase among the region’s major recipients. Yet investor optimism about its three-year outlook was minus seven, the lowest score of any market in the Kearney index. The data does not tell us why. But an agency looking only at the inflow figure would miss an important part of the picture. A perception problem needs different work from a structural one.
For Thailand, the different sources point in a similar direction. It is back in the Kearney index, its inflows rose 30%, and WIPO identifies it among the economies gaining ground in its income group.
At city level, the picture is different again. Savills ranks Bengaluru first in the world for growth to 2035, ahead of Ho Chi Minh City and other Indian and Vietnamese cities. WIPO’s innovation cluster ranking measures something else: the concentration of patents, scientific publications and venture capital deals. India has four clusters in the global top hundred. Southeast Asia has two: Singapore, ranked 16th, a cross-border cluster shared with Malaysia, and Kuala Lumpur, ranked 90th.
And Savills’ own Resilient Cities Index 2026 tells a different story. Singapore is the only Southeast Asian city in its global top twenty, at eighth place. No Indian city makes that list. Savills therefore sees Bengaluru as the world’s fastest-growing major city, but not among its twenty most resilient.
What the rankings miss
Indonesia is a good example of what these rankings can miss. It ranks 55th on WIPO’s innovation index and has no cluster in WIPO’s top hundred. Yet its investment is increasingly spread beyond its traditional economic centre. Between April and June 2026, total realised investment outside Java was slightly higher than investment in Java, accounting for 50.1% of the total against 49.9% on Java. This includes both domestic and foreign investment, not just FDI.
Central Sulawesi and North Maluku have grown much faster than the country as a whole in recent years, driven by mineral processing. Both were among the leading provincial investment destinations in the second quarter of 2026. Some of the largest projects are in provinces with nickel processing facilities rather than in major cities. Rankings based on patents, venture deals or urban growth do not capture this kind of development particularly well.
Is the China plus one story losing strength?
Worldwide, the value of announced greenfield projects stayed close to its 2024 level, but the mix changed. A small number of large projects, particularly in data centres, oil and gas and semiconductors, supported the total. Investment in global value chain-intensive manufacturing fell, and in Southeast Asia it more than halved in one year. UNCTAD points to tariffs and trade policy uncertainty as important factors in the global investment environment. That does not, however, explain why the decline in Southeast Asia was so much sharper.
One year is not enough to establish a trend. But these figures are a warning for a region that has built much of its investment promotion around supply chain diversification. India shows a similar pattern: overall FDI inflows increased, while the announced value of greenfield projects declined substantially.
Where the capital comes from
The source of the money matters too. Hong Kong was Indonesia’s largest source of foreign investment in the second quarter of 2026, at around US$5 billion, ahead of Singapore at US$4.2 billion and China at US$1.7 billion. Asked about it, Indonesia’s investment minister said that, for the first time in ten years, Chinese investors had moved more aggressively through Hong Kong. The figures therefore show the route through which the money entered Indonesia, not necessarily who ultimately owns it. It is unusual for a government to acknowledge this distinction so openly.
Singapore also has a major influence on regional averages. It attracted US$150.9 billion in FDI in 2025, more than 60% of the ASEAN total, and was the world’s second-largest recipient after the United States. Its role as a regional headquarters and financial hub is part of the explanation. A large part of Southeast Asia’s headline inflows is therefore concentrated in one city-state, and says relatively little about the other ten economies.
How we read it
What does this mean for investment attraction and positioning? Almost every economy in the region can claim a young population, growing consumption and openness to investment. All of that is true, but it no longer sets anyone apart. The Kearney survey shows that investors already have more specific views: India for talent, Thailand and Malaysia for ease of doing business, Singapore as a neutral headquarters location. These are more specific, and more credible, messages than the ones these places usually lead with.
A place that still presents itself mainly as a manufacturing alternative to China should be ready to explain the 2025 manufacturing figures. Serious investors will have seen them. And places attracting data centres should be clear about what this investment delivers: substantial capital commitments, but not necessarily large numbers of direct jobs.
We do not think places should try to manage their position in rankings. Most of these indicators move slowly, and several are national rather than local. More useful is to look at where the sources disagree: Malaysia’s inflows and investor sentiment, India’s two Kearney positions, Bengaluru’s growth and its resilience. Each points to a question an agency can actually work on.
Taken together, these six sources do not tell us whether announced investment is actually built, or whether it still employs people five or ten years later. They tell us how well a place attracts capital, but much less about what that capital means for the place in the long run.
Sources: Kearney FDI Confidence Index 2026; UNCTAD World Investment Report 2026; ASEAN Investment Report 2025 (ASEAN Secretariat and UNCTAD); ASEAN FDI figures for 2025; World Bank Business Ready; WIPO Global Innovation Index 2026 and its Top 100 Innovation Clusters ranking; Savills Growth Hubs and Resilient Cities Index 2026.
New rankings appear all the time. We keep track of those we consider most relevant, with location-specific summaries available via our Observatories of Cities and Countries.
This article is part of our series on investment attraction and how places make their case to investors. Read more in our Investment Attraction section.
Reporting supported by TPBO Senior Associate India & Southeast Asia, Abhinav Bhole.
Editorial note: This article reflects The Place Brand Observer’s interpretation of the information, reports and data available at the time of writing. While we have made every effort to represent the sources accurately, readers should consult the original sources and independently verify relevant figures and claims before using them to inform business, investment or policy decisions.